-5A5A5A?style=flat&logo=python&logoColor=white)









I'm Mukut May Dutta, a Data Scientist passionate about turning complex data into actionable insights and intelligent solutions. I specialize in building machine learning models, uncovering patterns in data, and transforming raw information into meaningful business outcomes. Using Python, SQL, Power BI, Tableau, and modern machine learning techniques, I develop data-driven solutions that help organizations make smarter decisions. My goal is to bridge the gap between data and strategy through analytical thinking, predictive modeling, and clear visual storytelling.
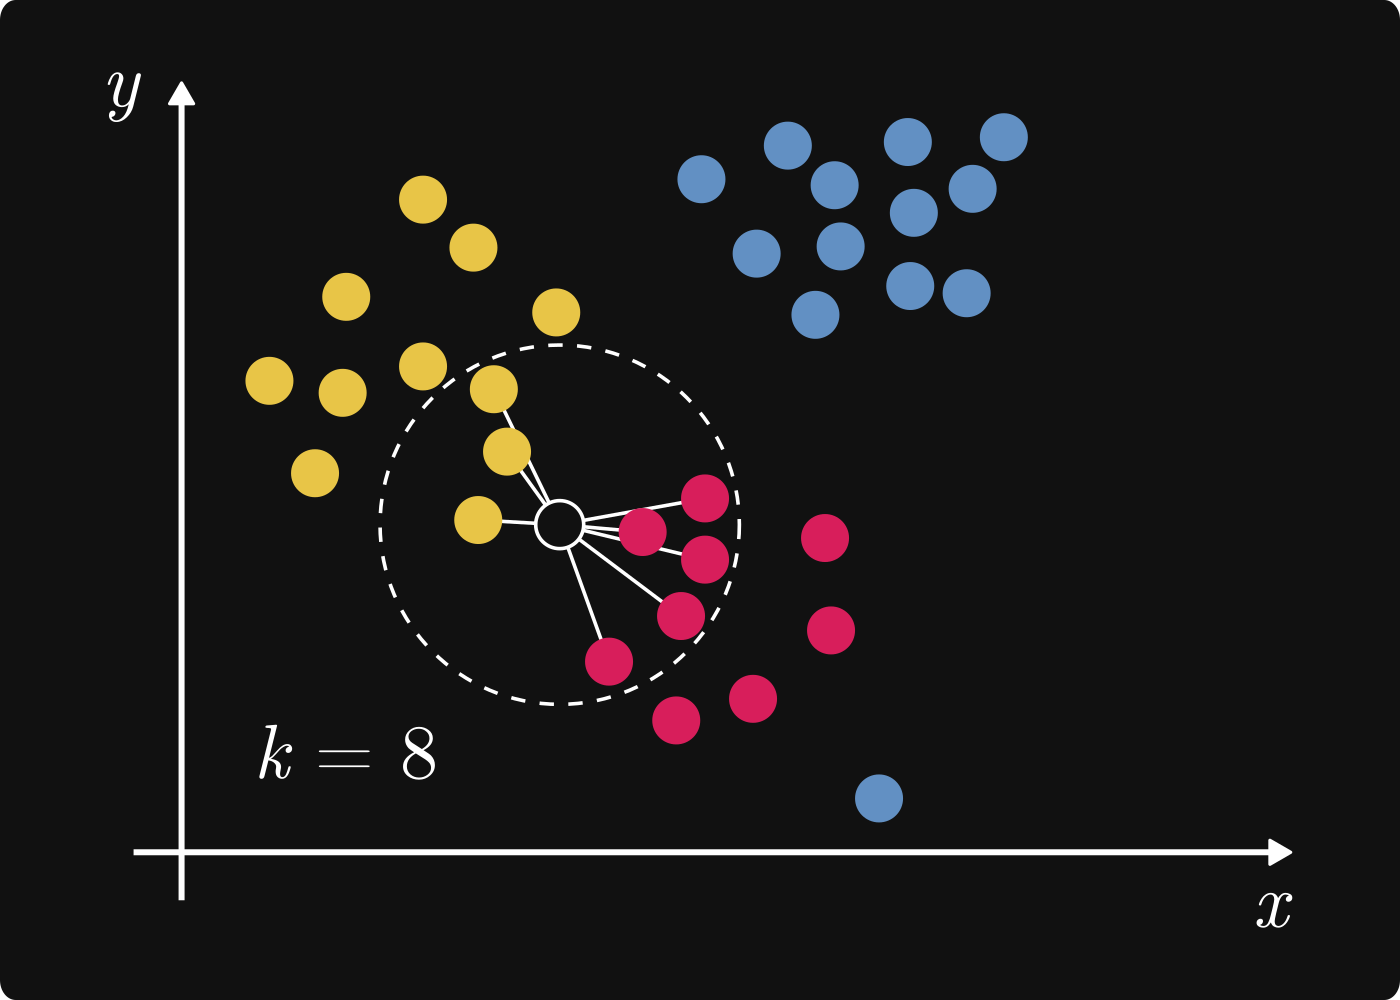
K-Nearest Neighbors (KNN) is a supervised machine learning algorithm that predicts the class or value of a data point based on the K closest data points in the dataset.
Tech: Python, Pandas and NumPy, Scikit-learn, Matplotlib/Seaborn, Jupyter, Git/GitHub
View on GitHub
AnimateDiff is an open-source framework that extends pretrained text-to-image diffusion models with motion modules to generate temporally coherent animations.
Tech: Table Diffusion, 3D UNet, CLIP, VAE, schedulers, DreamBooth/LoRA
View on GitHub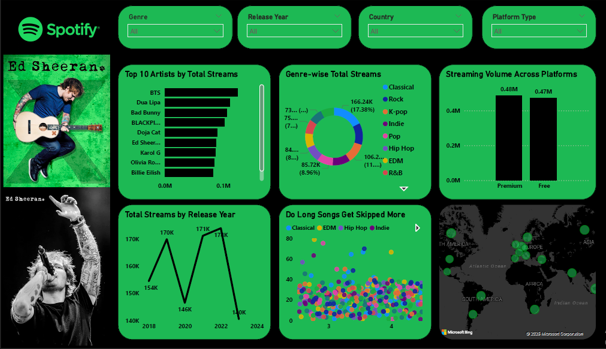
An interactive Power BI dashboard analyzing Spotify music trends and user behavior. Includes genre insights, top artists, regional patterns, and seasonal listening shifts.
Tech: Power BI, Python, Excel
View on GitHub
A detailed analysis of Goldman Sachs stock performance using Python and financial libraries. Covers stock trend visualization, moving averages, volatility, and returns analysis.
Tech: Python, Matplotlib, Pandas, yfinance
View on GitHub
Conducted an in-depth analysis of trending YouTube videos using Python. Extracted insights on viewer engagement, video categories, publishing patterns, and trending durations.
Tech: Python, Pandas, Seaborn, Matplotlib
View on GitHub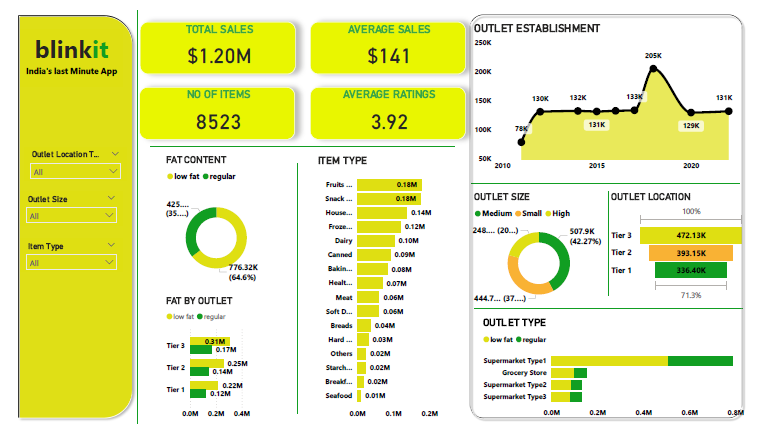
Developed an interactive sales dashboard to analyze Blinkit's product performance, category trends, revenue growth, and region-wise metrics using dynamic filters and key performance indicators.
Tech: Power BI, Excel, Power Query, DAX
View on GitHub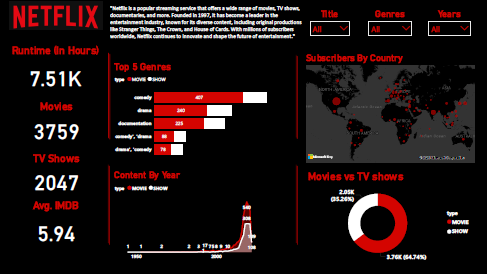
Created an interactive Power BI dashboard to analyze Netflix content by genre, release year, ratings, and country. Uncovered content trends and viewer preferences across regions.
Tech: Power BI, Excel, Power Query, DAX
View on GitHub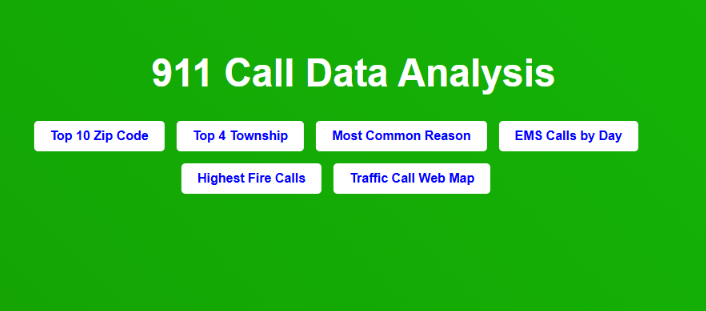
Analyzed emergency 911 call data to identify high-volume zip codes, call types, and response patterns. Built a Django web dashboard with interactive charts, maps, and filters for real-time visualization.
Tech: Python, Django, Pandas, Folium, HTML, CSS
View on GitHub
Performed a comprehensive analysis of Apple’s stock data to explore trends in volume, price movements, and volatility. Visualized key patterns and outliers to understand market behavior over time.
Tech: Python, Pandas, Matplotlib, Seaborn
View on GitHub
An in-depth analysis of HDFC stock performance using Python. Explored historical prices, volatility, moving averages, and market trends to generate meaningful insights for investors.
Tech: Python, Pandas, Matplotlib, yfinance, Seaborn
View on GitHub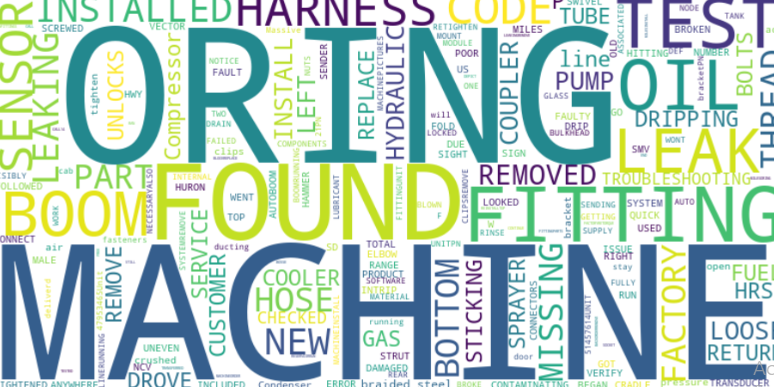
Built and deployed NLP models to extract insights from unstructured text data. Included sentiment analysis, topic modeling, and keyword extraction from various text sources.
Tech: Python, NLTK, spaCy, scikit-learn, Pandas, Matplotlib
View on GitHub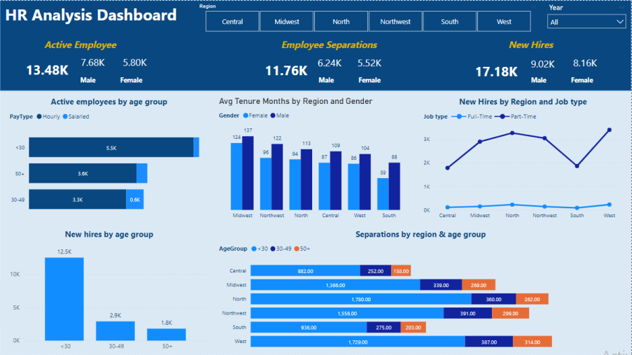
Performed end-to-end analysis of HR data to uncover patterns in employee attrition, satisfaction, and performance. Included visual insights and predictive modeling to support HR decision-making.
Tech: Python, Pandas, Matplotlib, Seaborn, Power BI
View on GitHub
In-depth analysis of IMDb movie data to uncover trends in ratings, genres, top-rated directors, and yearly production patterns. Visualizations highlight popularity by genre, time trends, and more.
Tech: Python, Pandas, Matplotlib, Seaborn, Jupyter Notebook
View on GitHub
Comprehensive analysis of Flipkart mobile listings including brand performance, price segmentation, rating trends, and key features like memory, storage, and color. Insights visualized using Python libraries.
Tech: Python, Pandas, Matplotlib, Seaborn, Jupyter Notebook
View on GitHub
H&M coustomer data analysis for buying trand using python libraries. Here we have analysed the buying trand and most selling months of H&M.
Tech: Python, Pandas, Matplotlib, Seaborn, Jupyter Notebook
View on GitHub